

Home / For Professional Services
Business analytics for professional services firms.
Consulting, agency, accounting, and law practices live in QuickBooks, Stripe, and time-tracking exports. Drop those exports into DashViz and it turns them into one dashboard with utilization, billing, A/R aging, and client profitability — and lets you ask follow-up questions in plain English.
Common metrics for professional services
- Utilization rate (billable hours / available hours)
- Realization rate (billed amount / standard rate × hours)
- Average revenue per client
- A/R aging (0-30, 31-60, 61-90, 90+ days)
- Client concentration (top 10 clients as % of revenue)
- Project profitability (revenue minus tracked costs)
- Recurring vs. project revenue mix
What DashViz does for professional services businesses
DashViz works for professional services the same way it works for every other business: connect data, get dashboards, ask questions, set alerts.
- Connect your data — DashViz auto-generates a dashboard with the metrics that match.
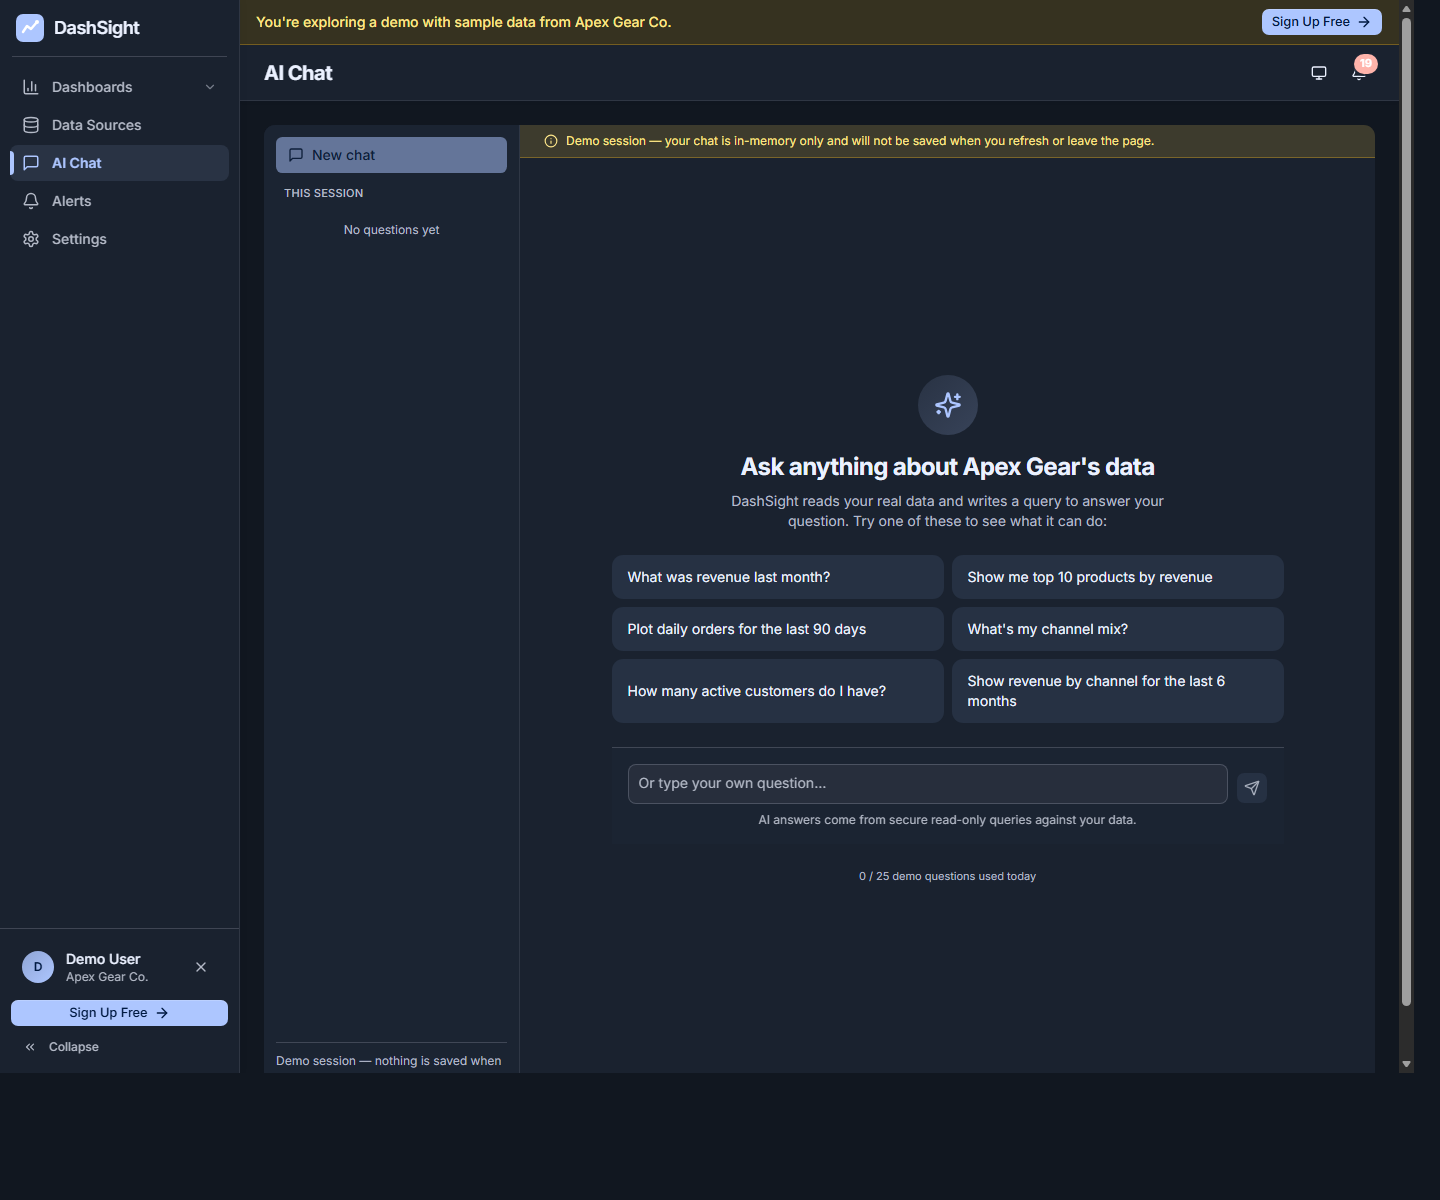
- Ask questions in plain English — DashViz answers from your connected data.
- Set alerts on the metrics that matter — get notified by email or SMS.
- Combine data sources — pull a single view across your accounting, sales, and operations data.
Common data sources for professional services
- QuickBooks Online (P&L, A/R, A/P, expenses)
- Stripe (recurring revenue, subscription clients)
- Time-tracking CSV exports (Harvest, Toggl, Clockify, BigTime)
- Spreadsheet client lists
Related DashViz data-source pages
Example questions professional services owners ask DashViz
- "What was my utilization rate last quarter, by team member?"
- "Which clients have unpaid invoices over 60 days?"
- "What's my profitability per project this year?"
- "How does this month's revenue compare to last month?"
- "Which industries are driving the most revenue?"
Common questions about professional services analytics
What metrics should professional services businesses track?
Professional Services businesses commonly track Utilization rate (billable hours / available hours), Realization rate (billed amount / standard rate × hours), Average revenue per client, A/R aging (0-30, 31-60, 61-90, 90+ days). DashViz can also surface other metrics when the connected data supports them.
Can DashViz answer professional services questions in plain English?
Yes. For example, a professional services operator can ask "What was my utilization rate last quarter, by team member?" and DashViz will answer from the connected data with a metric, table, chart, or short explanation.
What data sources matter for professional services analytics?
Common sources include QuickBooks Online (P&L, A/R, A/P, expenses), Stripe (recurring revenue, subscription clients), Time-tracking CSV exports (Harvest, Toggl, Clockify, BigTime), Spreadsheet client lists. Whatever lives in spreadsheets you can upload today; native SaaS integrations are included on Pro.
Is DashViz only for e-commerce?
No. DashViz is vertical-neutral business intelligence for SMBs. The professional services page highlights one lens, but the same product works across retail, services, hospitality, SaaS, wholesale, manufacturing, and other business models.
Why DashViz beats spreadsheets for professional services
Most professional services firms spend 4-8 hours a month rebuilding the same A/R aging spreadsheet, the same utilization report, the same revenue breakdown. Drop your QuickBooks exports into DashViz once a month and it rebuilds those reports automatically — so the partner meeting can be about decisions, not data assembly.
Try DashViz on your professional services data.
14-day free trial, no credit card required.